06
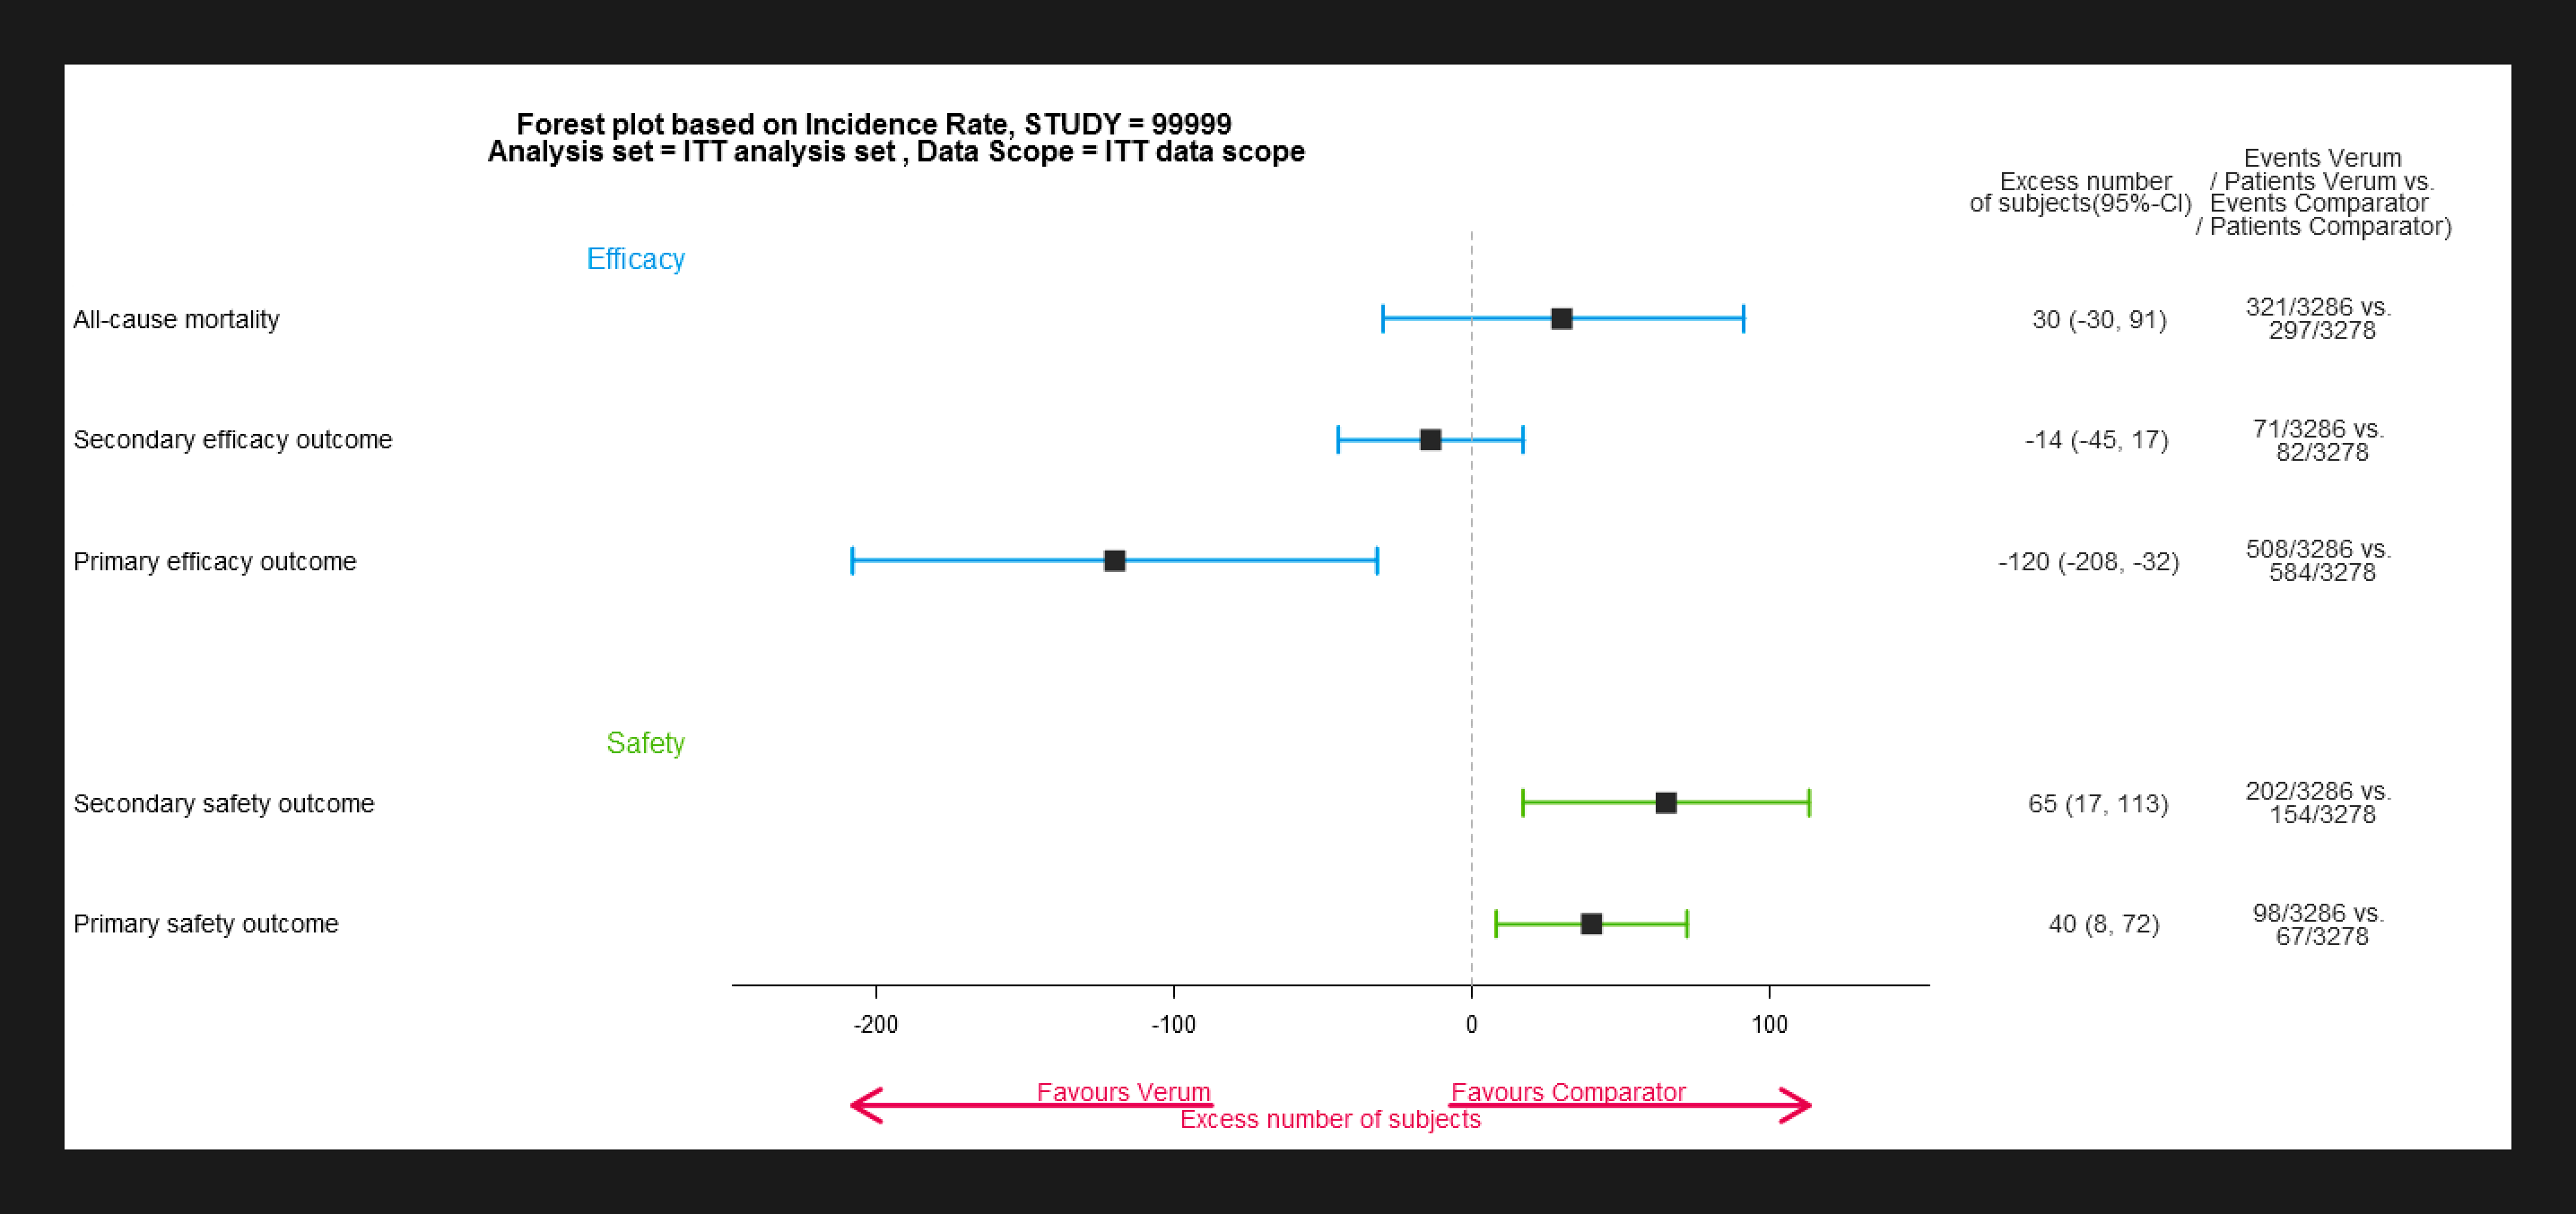
Quantative Analysis:Benchmarking analysis
Quantative Analysis:Benchmarking analysis
Why I Use Benchmarking Analysis?
Benchmarking can provide an efficient and effective means for a firm to take the best ideas from other
firms, integrate them into their own, and take actions that may provide it with a strong advantage over
their competitors.
1. Products need to Be Benchmarked
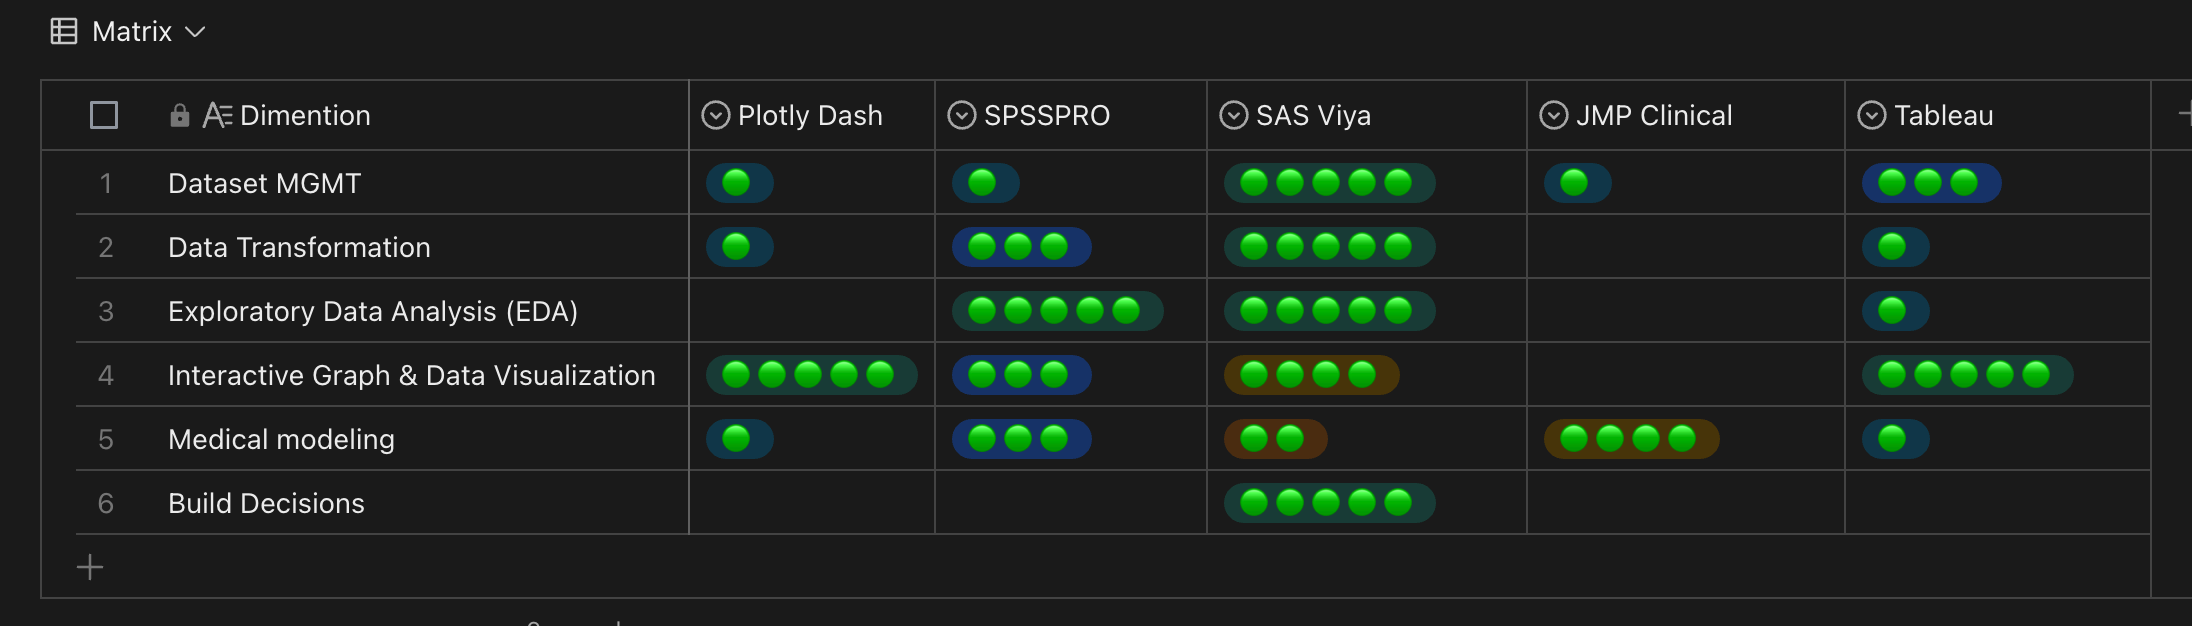
In this quantitative research, I selected five representative products in the field of medical statistics,
namely SAS Viya, Plotly Dash, SPSSPRO, JMP Clinical, and Tableau. I chose them individually because they
have significant influence in the life science professionals' domain and are recognized by global
associations such as DIA and software user groups in life science like PharmaSUG. The factors contributing
to their influence include efficiency and speed, collaboration capabilities, scalability, advanced
analytics, model deployment, integration with other tools, and user-friendly interfaces.

benchmarking Products
2. Statistics processes
Dimension that need to be benchmarked, and its explanation:
a. Data Management: Utilize common methods such as merging,
concatenating, or joining datasets based on shared variables. Choose the appropriate join type (e.g.,
inner join, outer join, left join, right join) depending on the analysis nature and data relationships.
b. Data Transformation: Convert data into a suitable format and
normalize or standardize it if necessary.
c. Exploratory Data Analysis (EDA): Proficiency in exploratory
analysis is crucial for data scientists. They employ EDA to analyze datasets, summarize key
characteristics, and utilize data visualization methods. EDA helps in determining the best approach to
manipulate the data source for desired insights, facilitating the identification of patterns, anomalies,
hypothesis testing, and assumption examination.
d. Interactive Graphs & Data Visualization: Data visualization
is pivotal for simplifying complex datasets and effectively communicating insights. It enables users to
identify patterns, trends, and anomalies, fostering a deeper understanding of the data. Ultimately, it
plays a crucial role in facilitating informed decision-making by transforming data into visual
representations.
e. Medical Modeling Development: Statistical models like
Kaplan-Meier Survival Curve, Ridit Analysis, and Chi-Square Test are commonly used in clinical research.
f. Decision Building with AI, ML, Modeling: Clinical
statisticians can leverage these tools to gain deeper insights from clinical data, identify patterns, and
enhance predictive modeling in areas such as patient outcomes and treatment efficacy.
1. Tableau
Product concept:
A powerful data visualization tool that enables users to create interactive and shareable
dashboards, allowing for intuitive exploration and understanding of complex datasets.
Pros:
1. Has basic dataset processing capabilities and strong capabilities in visualizing data.
Cons:
1. However, it performs weakly in medical scenarios and lacks accumulated experience in medical
modeling.
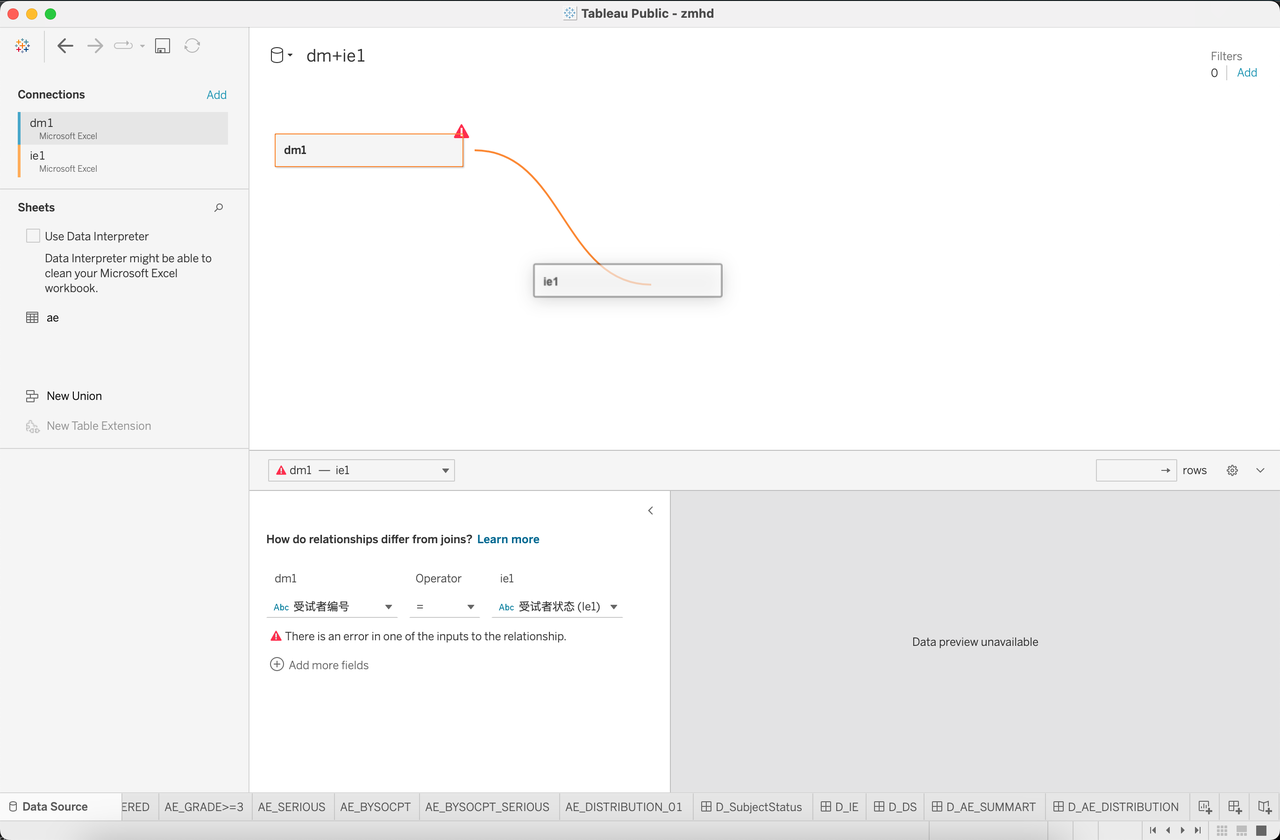
Join Dataset
Data visualization
2. SAS Viya
https://azureuse011456.my-trials.sas.com/SASDataExplorer/
Product Concept:
SAS Viya is a robust analytics platform designed to empower organizations with efficient,
collaborative, and scalable data analysis, machine learning deployment, and advanced analytics
capabilities.
Pros:
It offers advanced analytics, scalability, and efficient collaboration for diverse life science
professionals.
customization of figures.
Cons:
Its extensive functionalities may require a steeper learning curve for some users.